“Marketing is no longer about the stuff that you make. But about the stories you tell.” – Seth Godwin
There are brands out there that make an effort to understand the little things about their audience and customers. Right from their age, emotions, trends, challenges, and everything else, they pick out the most relevant data and use it for marketing purposes.
If we look closely at the brand “Fevicol,” it used storytelling techniques for marketing and made itself synonymous with instant glue. Similar examples include Colgate, Limca, Cadbury, and many more. All these brands have done is use their data to tell an emotionally binding or comic story about their audience, to their audience. And they have done it in the limited era of technology! Therefore, imagine the possibilities businesses can explore in today’s data-driven world.
We have noticed that in today’s data-driven world, businesses constantly seek ways to make sense of the vast amounts of data they collect. One of the most effective ways to do this is through data storytelling!
What is Data Storytelling?
Data storytelling is the art of communicating complex information in a simple and engaging manner using data visualization.
Let us consider a simple example of selling cloud spaces.
If a marketing story is framed around the challenges of physical servers, everyone facing the challenge can connect to it. They will relate to the problem and eagerly see what solution is provided. And when the end of the story offers the solution as cloud solutions, the audience seamlessly connects to the brand.
In fact, researchers claim that if you really connect to the customers’ problems, they sometimes stay loyal to the brand despite price differences.
So now that you have got a glimpse of what storytelling is, let us tell you how the combination of storytelling and Power BI can help you utilize the power of data in the best way!
Data Storytelling and Power BI
Power BI is a powerful business intelligence (BI) tool that can be used to tell data stories.
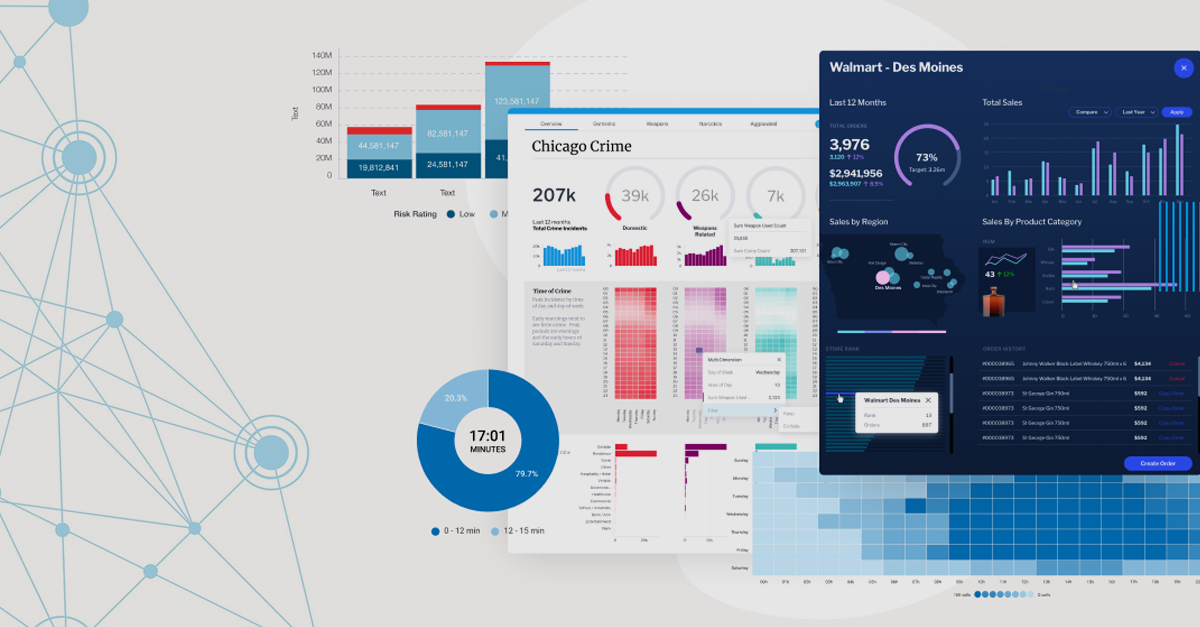
With Power BI, you can easily connect to various data sources, clean and transform your data, and create interactive dashboards and reports. You can also use Power BI to create custom visuals and add annotations to your data visualizations.
Combining data storytelling with Power BI allows you to create compelling and informative stories to help your audience understand your data and make better decisions.
When you have a platter of data served most immaculately, it is easy to target a specific section and weave a story around it.
For example, suppose the analytics show that a particular age group is browsing the company’s page at certain hours or customers use a similar word to portray their concerns or problems. In that case, all you have to do is weave a story around the central idea. This main idea must connect to the customer’s emotions in a witty, practical, funny, or any other positive way. Once audiences connect with the story, they are easier to convert and retain.
Data Storytelling and Power BI
Power BI assists data storytelling in every possible way—combining these two leads to incredible results.
Also, there are many benefits to using data storytelling to communicate your data insights.
Here are a few of the most important benefits:
How to Tell a Data Story with Power BI
Here are a few tips on how to tell a data story with Power BI:
Conclusion
Data storytelling is a powerful tool that can be used to communicate your data insights effectively. Combining data storytelling with Power BI allows you to create compelling and informative stories to help your audience understand your data and make better decisions.
If you want to learn more about data storytelling, contact us; we will help you in every step. Right from incorporating Power BI to profoundly understanding your data, our experts help you in every step.
So what are you waiting for? Start telling data stories today!


